
Reducing Polarization in Social Media
Introduction
- Real world events such as Brexit and the 2016 U.S. presidential elections give us a clear hint about the polarization our society is witnessing.
- Social media polarization has a strong effect on politics, opinion formation and how people interact with each other in a society.
- Users of social media are now receiving biased information that amplify their own viewpoints.
Introduction
- Our goal is to decrease the polarization by proposing new social connections.
- In a real world setting, new social connections are not always accepted.
- Link prediction and acceptance probabilities.
What is Polarization?
- Polarization describes the division of people into two contrasting groups or sets of opinions or beliefs.
- The term is used in various domains such as politics and social studies.
- Users tend to join communities of like-minded individuals. These communities are referred to as echo chambers or filter bubbles
The Friedkin and Johnsen Model
- A social graph G = (V, E) with n nodes and m edges. Each edge (i, j) is associated with a weight Wij ≥ 0
- The edge expresses the strength of the connection between i and j, and the influence they exert to each other
The Friedkin and Johnsen Model
- Each user u will have an internal opinion Su and an expressed opinion Zu
- Internal opinions are fixed and represent the opinions of the individual
The Friedkin and Johnsen Model
- Expressed opinions depend on the individual opinion of the person in combination with the expressed opinions of the network e.g. the friend list of a user
- Opinions are real numbers ∈ [-1,1] depending on the viewpoint of each user. -1 reflects a negative opinion while +1 a positive one. 0 is the neutral opinion
The Friedkin and Johnsen Model
$$z_i = \frac{w_{ii}*si + \sum_{j \epsilon N(i) }{w_{ij}*z_j}} {w_{ii} + \sum_{j \epsilon N(i) }{w_{ij}}}$$
The Polarization Index
- We measure the polarization by its distance from a neutral opinion. We can quantify this with the length of the vector of the second norm.
- This value can be independent of the network if we normalize it by dividing with the size of the graph.
$$\pi(z) = ||z||_{2}^2$$
Problem definition
- Let G = (V, E) be a connected undirected graph representing a network and k a given number of edges.
- Let z be the vector of expressed opinions for the whole network and π(z) the polarization index of this social graph.
- Let also C⊆V×V set of edges that are not in the graph.
Problem definition
[k-Addition]
We want to find a subset of S ⊆ C of k edges whose addition to a graph G will maximize the reduction of the polarization index π(z).
Problem definition
[k-Addition-Expected]
Let also P (u, v) a probability that the edge addition u, v is accepted. We want to find a subset of S ⊆ C of k edges whose addition to a graph G maximizes the expected reduction of the polarization index π(z).
Algorithms
Intuition
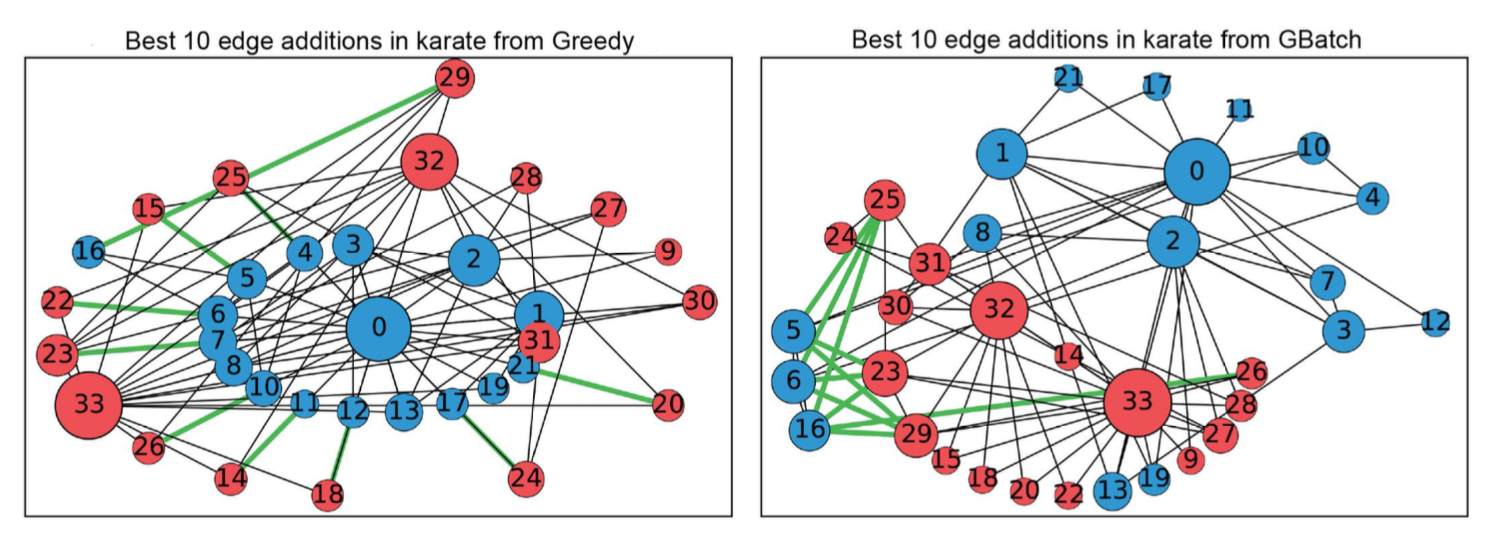
The algorithms consider nodes that have high expressed value. According to our model the biggest decrease is happening when we connect different and extreme opinions.
Algorithms
Overview
That recompute the opinion vector
Greedy
FirstTopGreedy
ExpressedOpinion
That do not recompute the opinion vector
GreedyBatch
FirstTopGreedyBatch
Experimental Results
Datasets
karate
books
beefban
polblogs
GermanWings
ClintonTrump
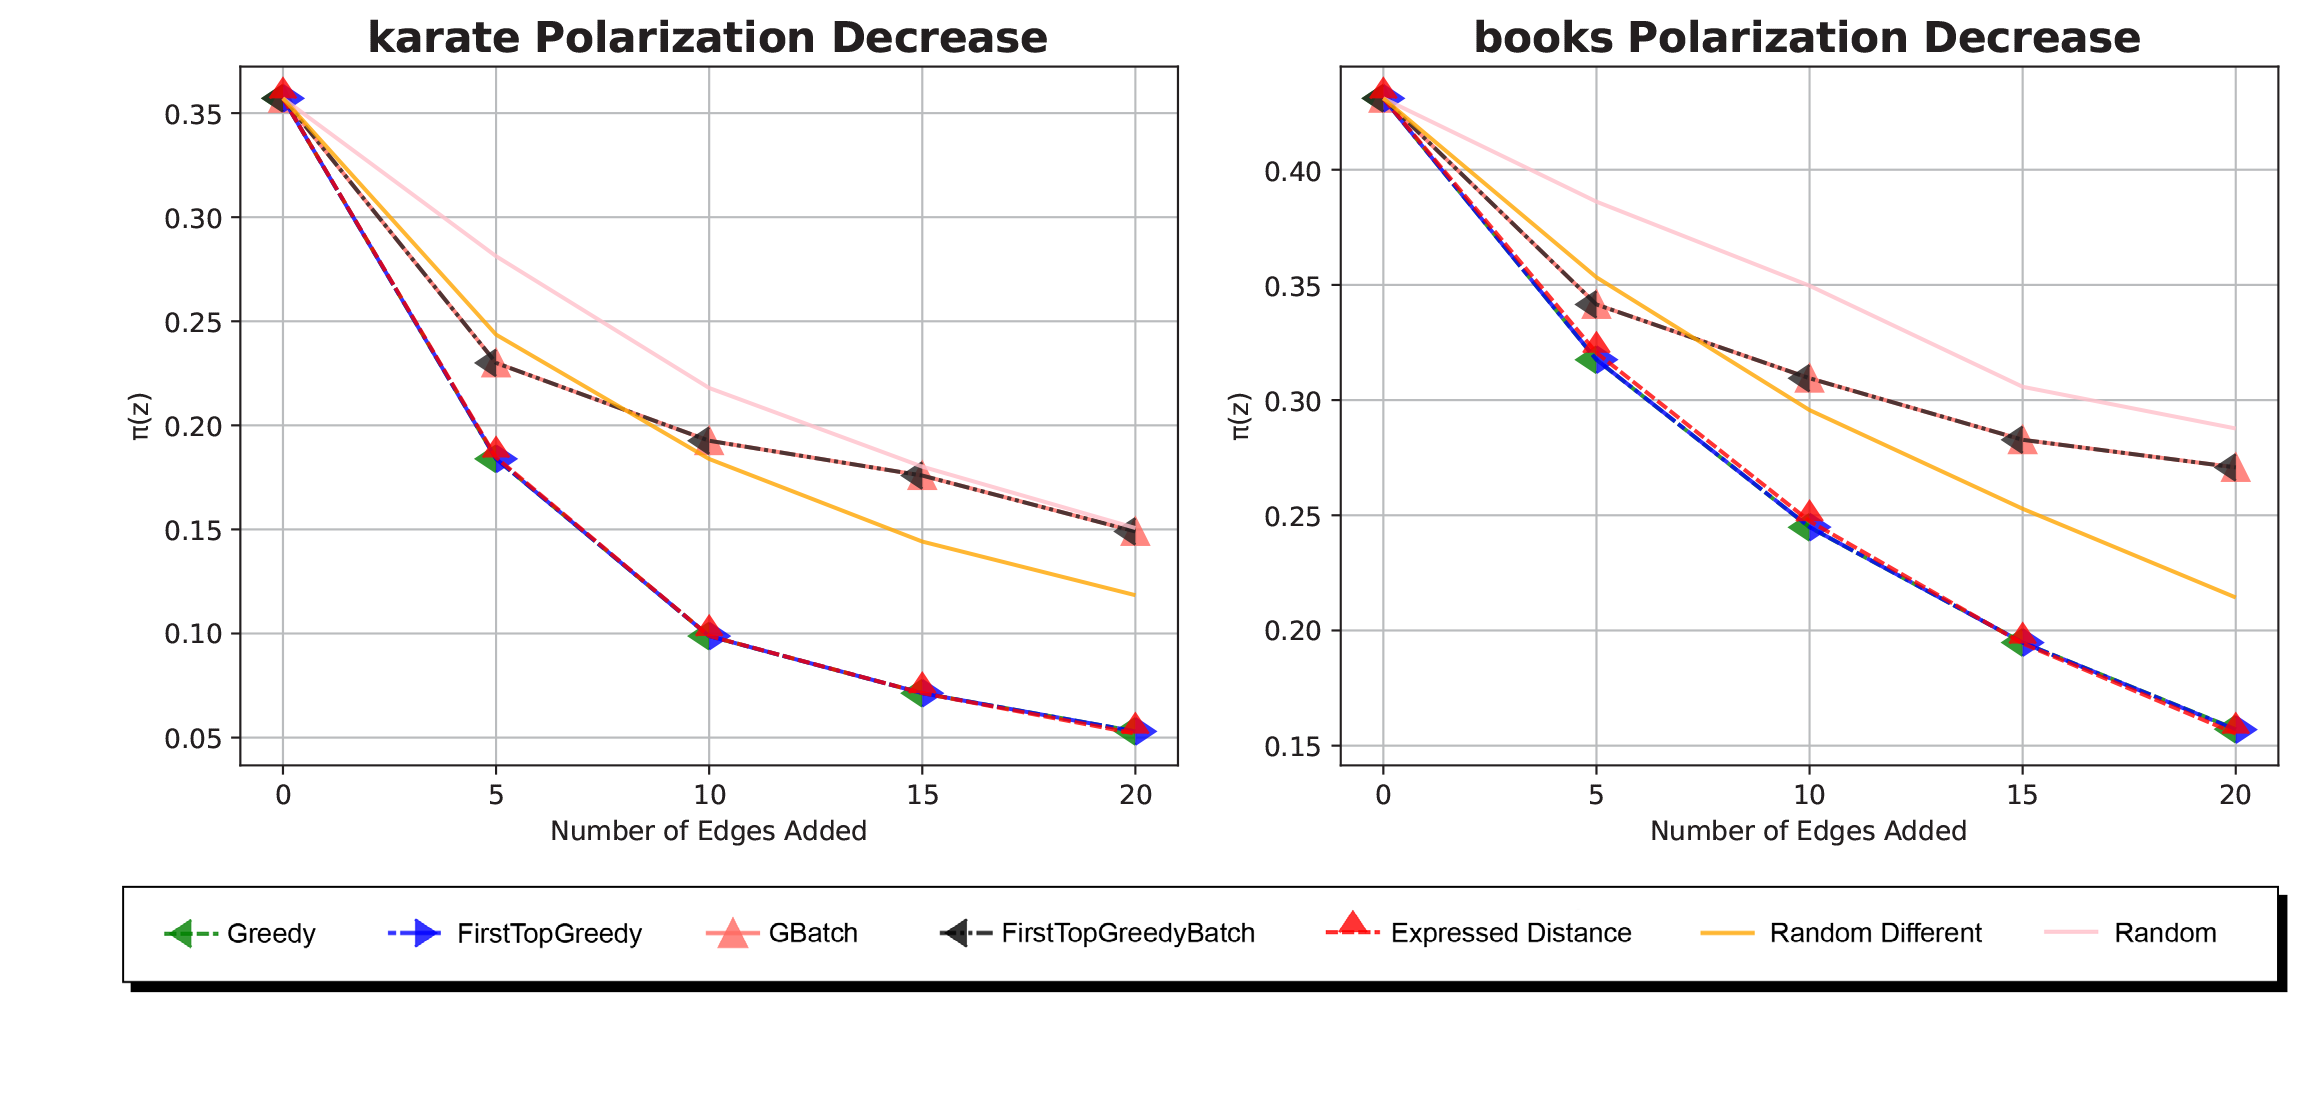
Experimental Results
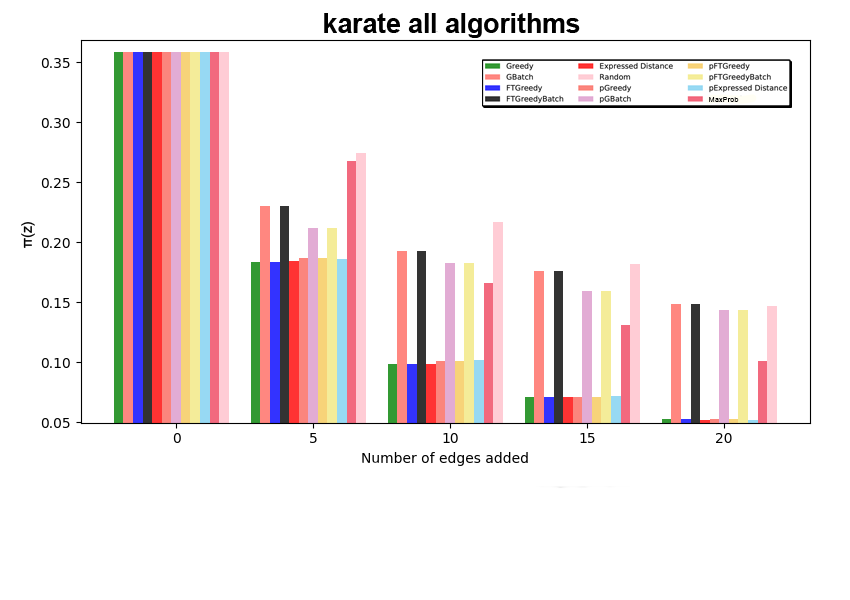
Polarization decrease
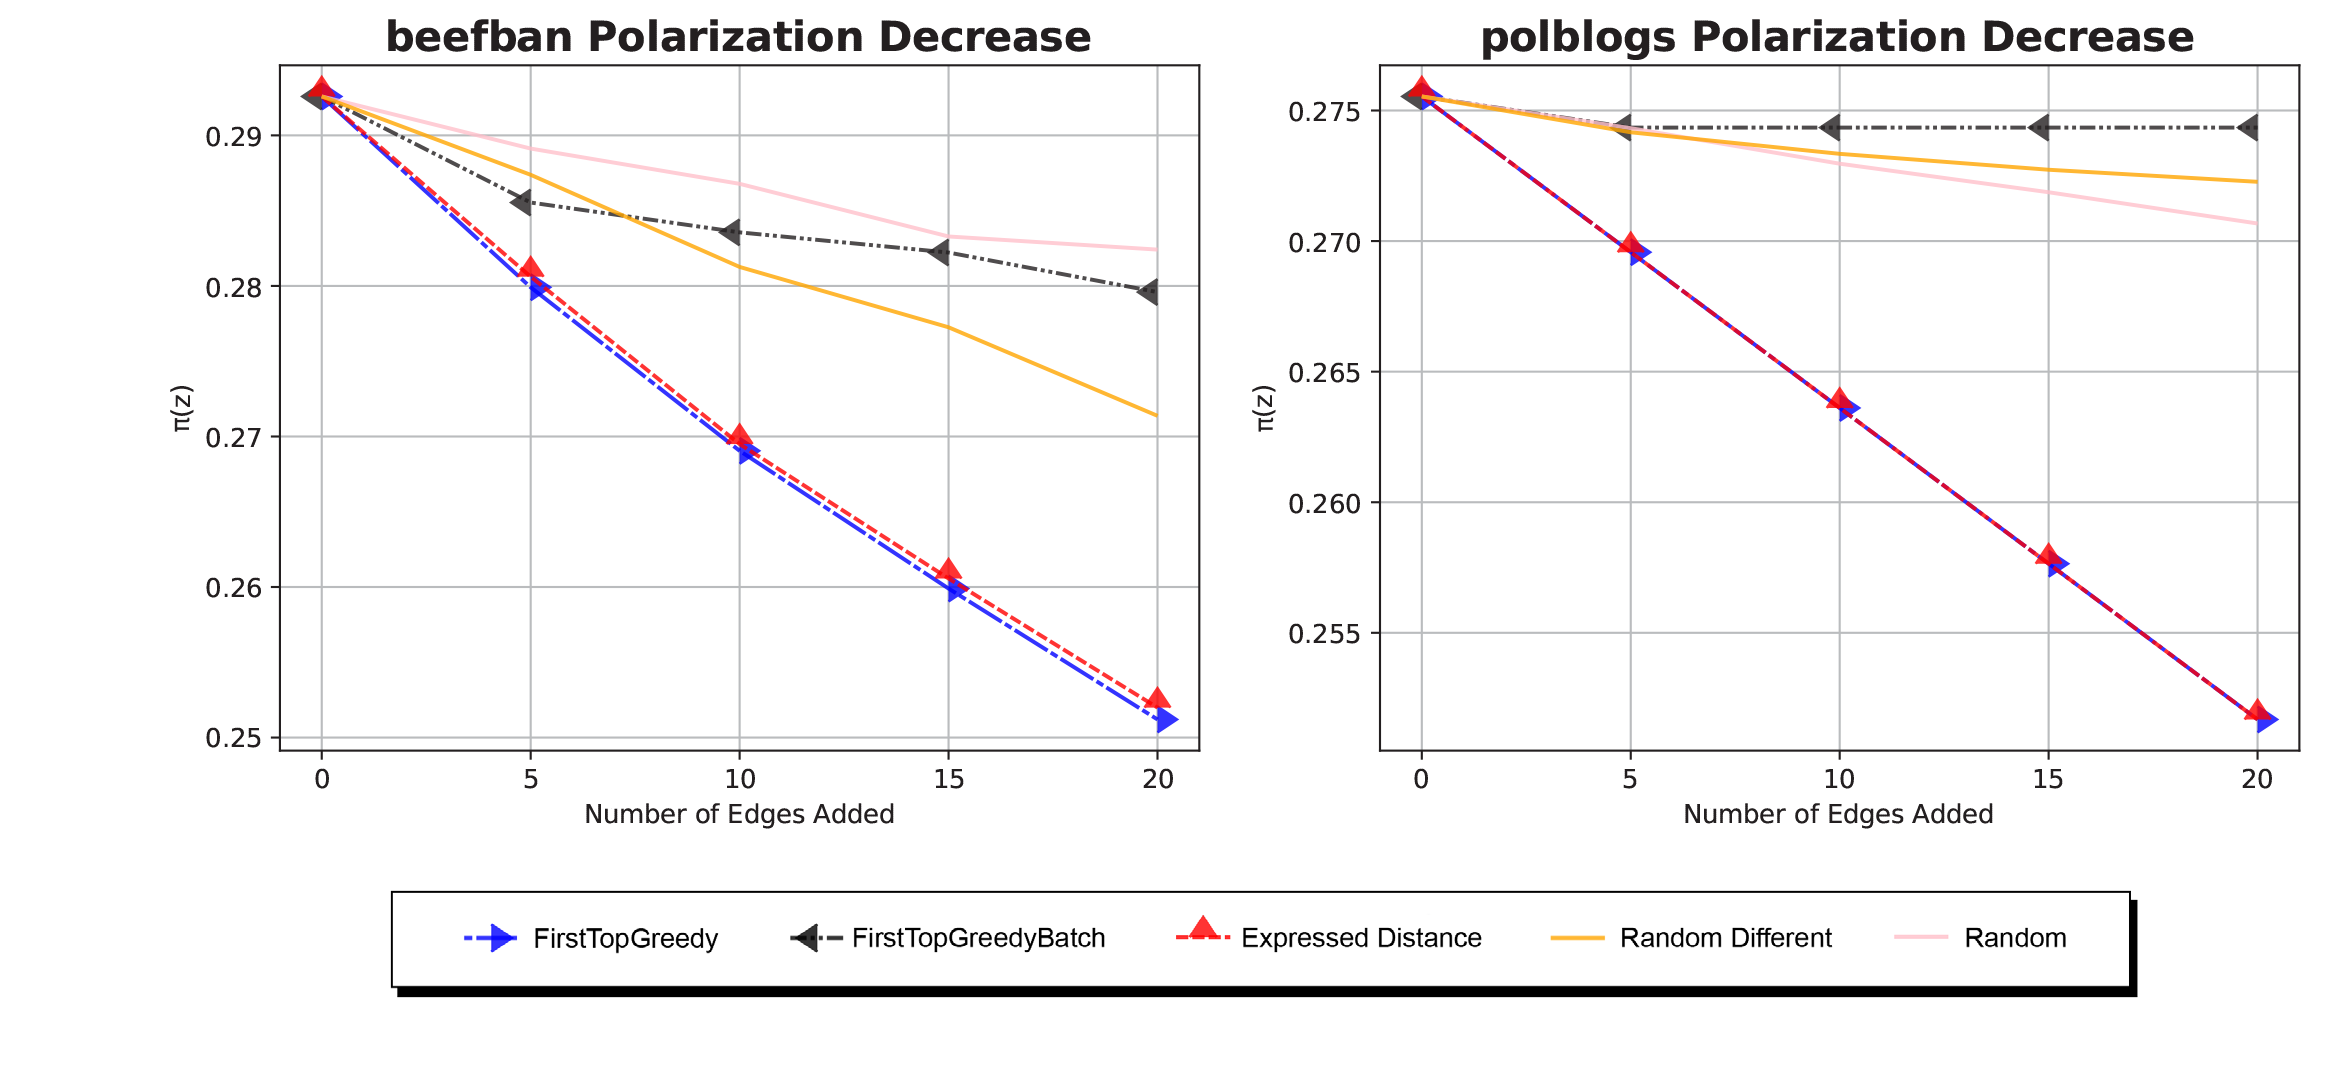
Experimental Results
Polarization decrease
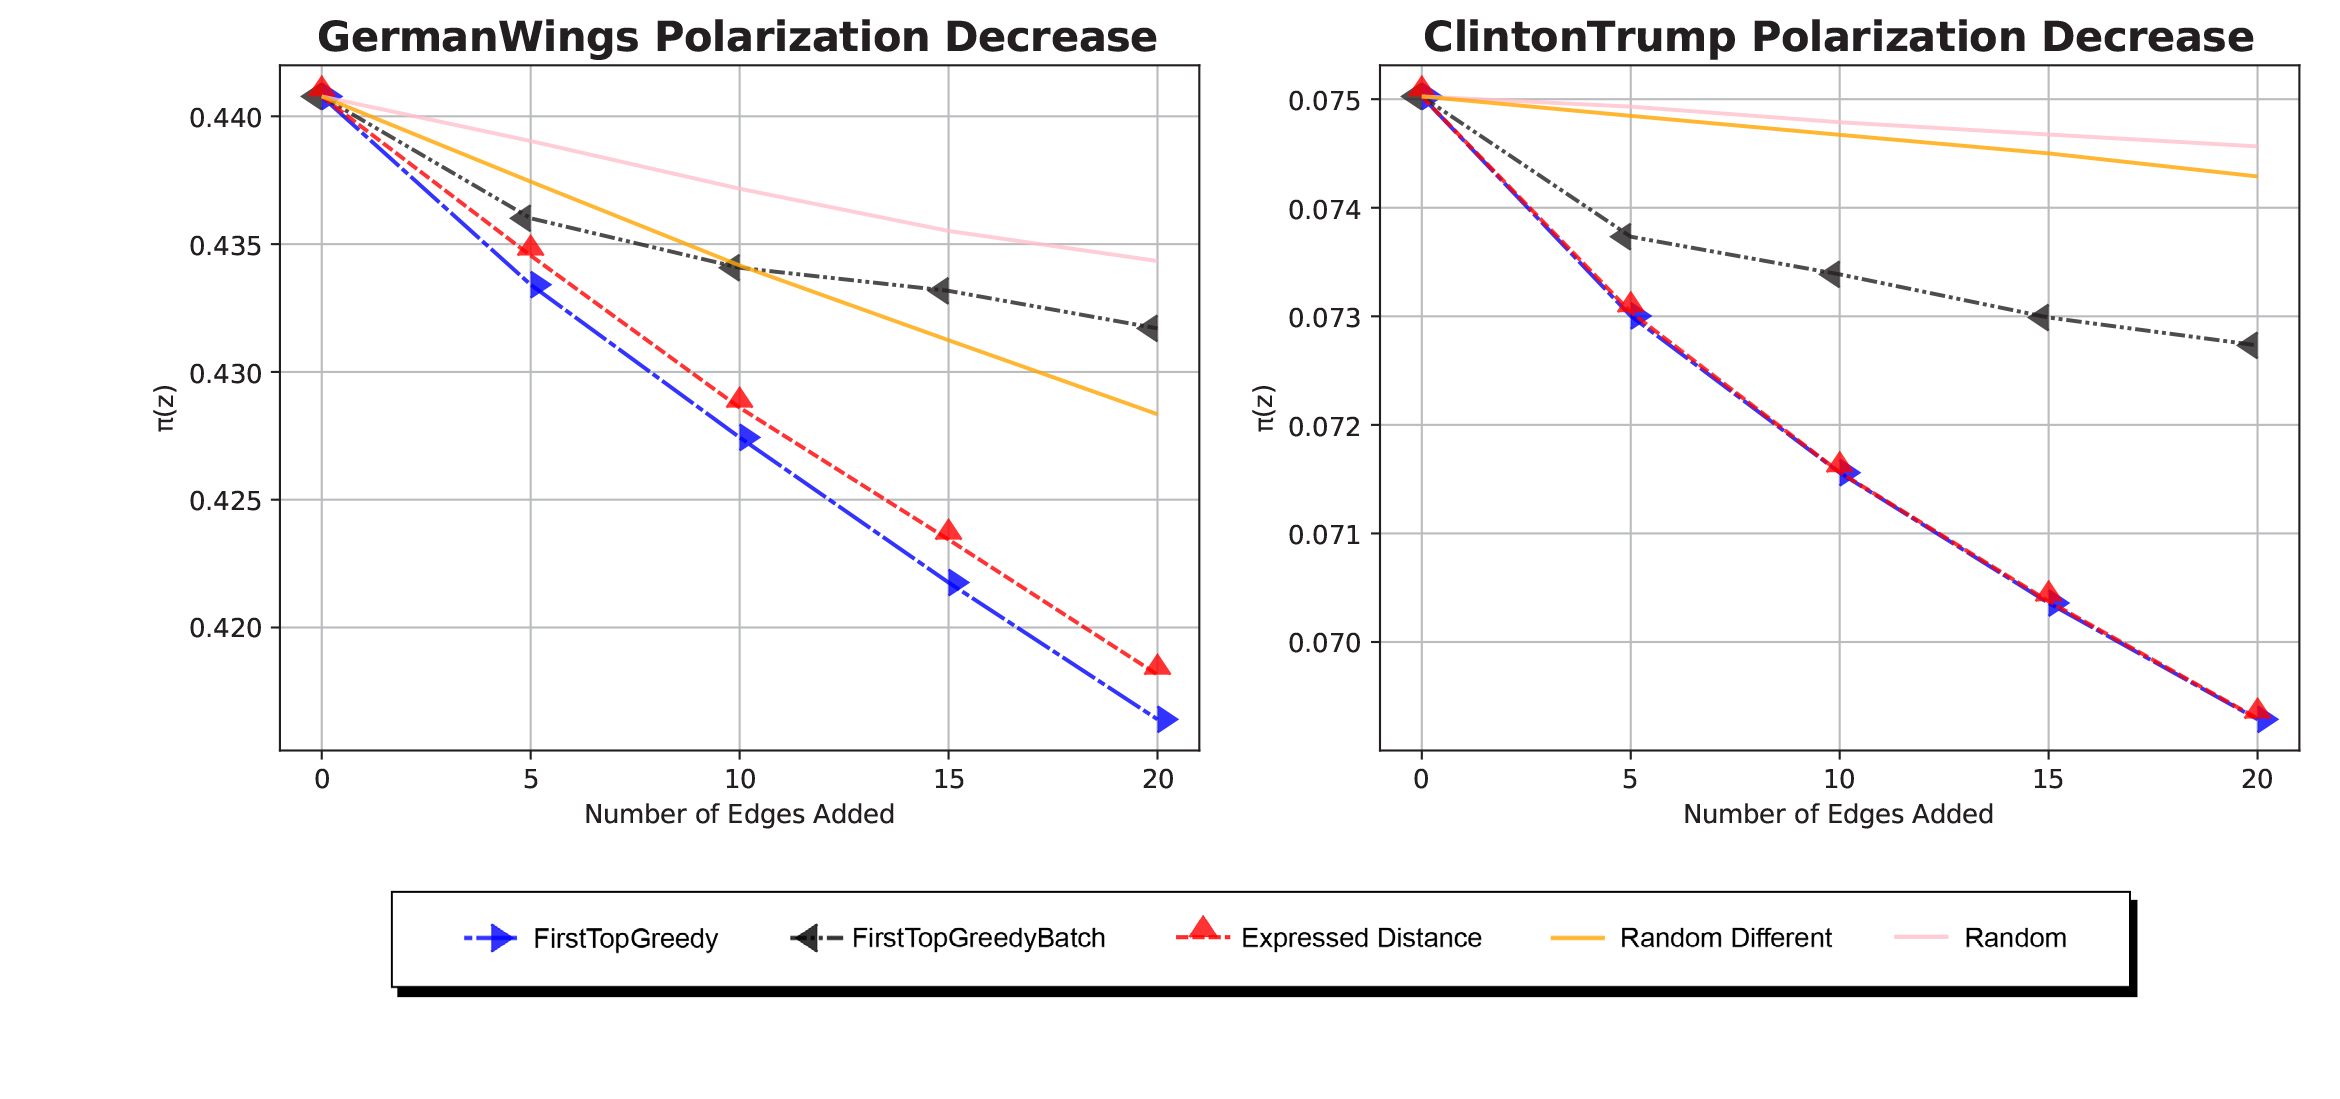
Experimental Results
Polarization decrease
Edge additions
Algorithms
Including Probabilities in the Algorithms
Using graph embeddings we transform the properties of the graphs to vectors. The embedding will capture the topology of the graph and will consider the relationship between nodes. The embedding will be used to make predictions on the graph.
Our objective is to predict whether there would be a link between 2 unconnected nodes. Node2Vec is used for obtaining a probability.
Including Probabilities in the Algorithms
- We then use the acceptance probabilities in combination with the distance of the opinions or the decrease of π(z).
- P(u,v)*val(u,v)
Including Probabilities in the Algorithms
- pGreedy
- pFirstTopGreedy
- pExpressedOpinion
- pGreedyBatch
- pFirstTopGreedyBatch
Measuring the mean probability
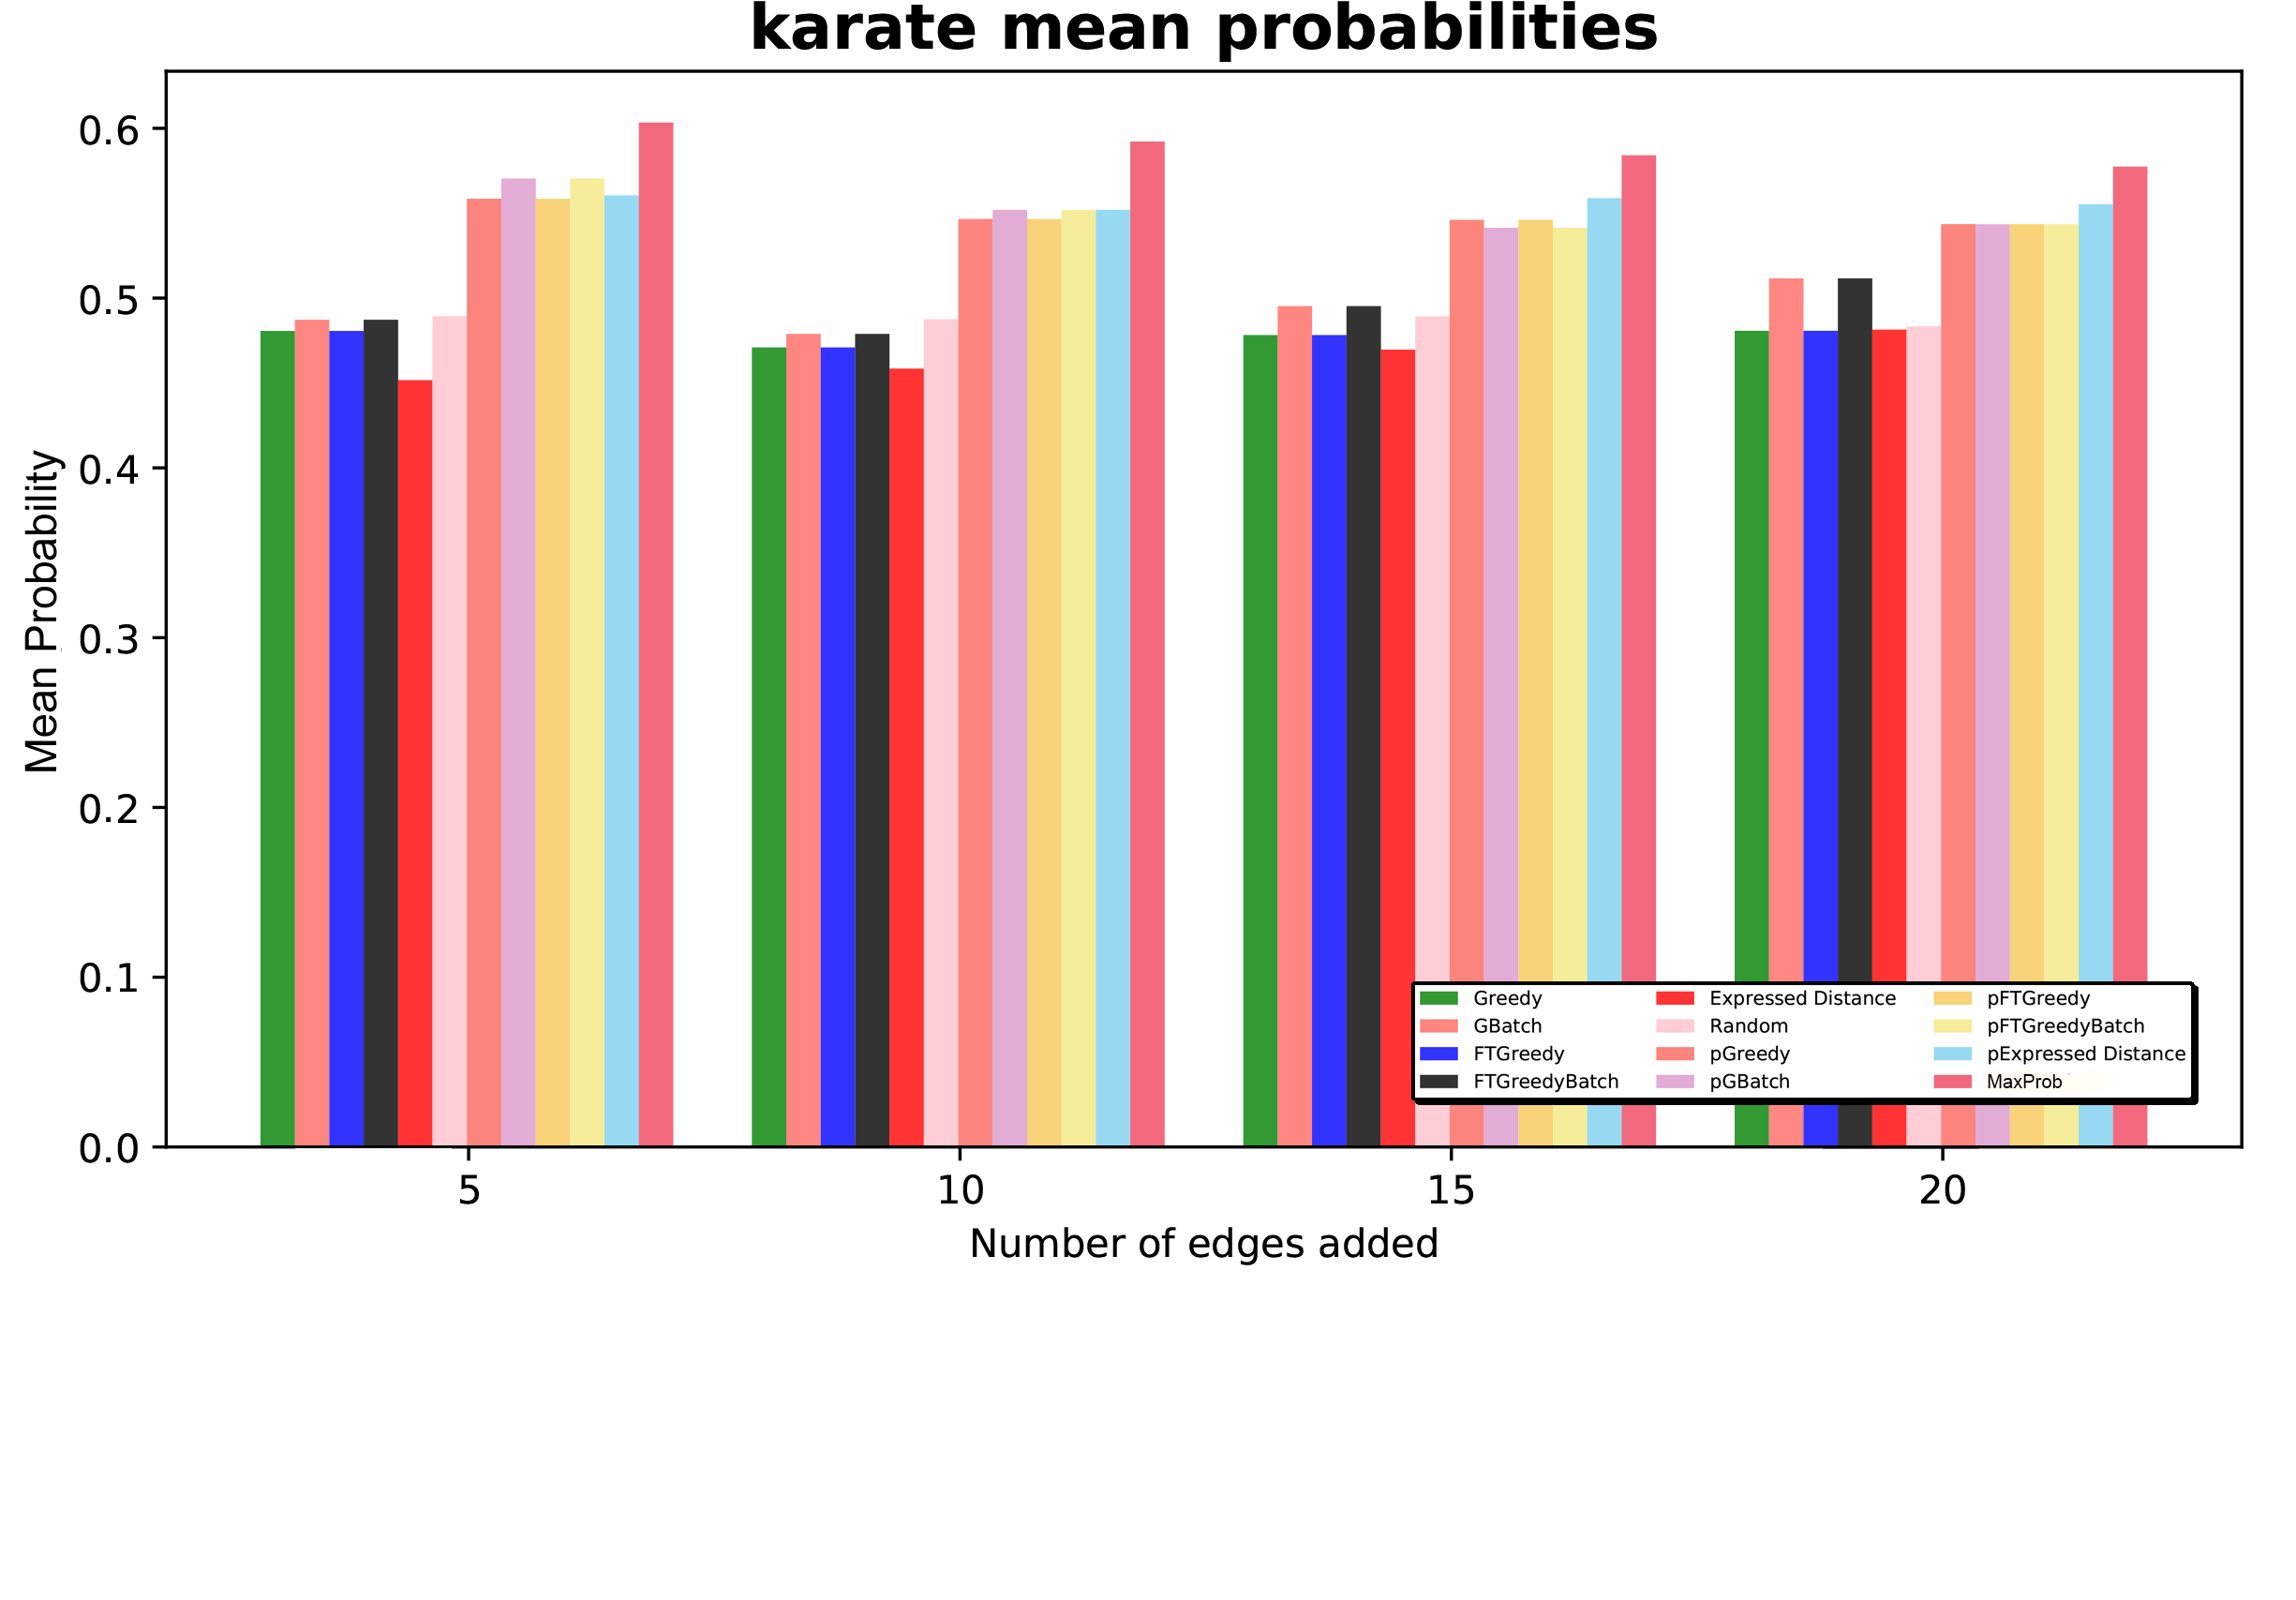
Comparing the results
Conclusions
- The ExpressedOpinion performs very well and is cheap on time.
- Batch algorithms perform very poorly, even worse than Random.
- Tradeoff between using probabilities.